Ionic conductances underlying excitability in tonically
firing retinal ganglion cells of adult rat
This work was carried out in 2006-2007 at Bogomoletz institute of physiology and International center
for molecular physiology (Kiev, Ukraine).
Yuriy O. Kolodin carried
out electrophysiological recordings and wrote
manuscript.
Oleksii O. Grygorov
carried out polymerase chain reactions .
Contact: ykolodin@mail.ru
The main results of
this work was presented at:
1. International Workshop of The Physiological Society
“Molecular
physiology of membrane transport and cell excitability”,
19-23
September 2007, Yaremche,
Ukraine. (Award for the best
presentation from The Physiological Society to Yuriy Kolodin)
2. Joint Meeting of The Slovak Physiological Society,
The
Physiological Society and The Federation of European
Physiological Societies. September 11th-14th,
2007, Bratislava,
Slovakia.
3. International Symposium dedicated to the memory of
Professor
Skok, Bogomoletz
Institute of Physiology (Kiev, Ukraine) 27th-
29th of September 2007 (Sponsors: The Physiological
Society, The
National Academy of Sciences of Ukraine).
Last updated: 27 April 2008.
Abstract
Intrinsic firing properties of
retinal ganglion cells (RGCs) of mature (1 month old)
rat were studied in retinal flat-mounted preparations using whole cell current
clamp recordings. In response to 500-ms depolarizing current step the majority
(94.1%) of the examined RGCs (n=85) displayed
sustained firing that lasted for the duration of the depolarization period
(tonic RGCs). In addition, 63.5%
of the cells had clearly a tonic fast-spiking phenotype with the
steady-state firing frequency in the range 50-124 Hz. The rest few (5.9%) RGCs always
displayed transient firing accommodated within duration of the current steps (phasic RGCs). Ionic conductances underlying excitability in tonically
firing neurons were studied by applications of selective pharmacological blockers. Application of TTX (1 μM) caused
reversible disappearance of action potentials (APs)
in response to stimulus. Suppression of Ca2+ influx through
voltage-activated Ca2+ channels by 200 μM Cd2+
resulted mainly in moderate increase of steady-state firing frequency and
increase of single AP repolarization rate, however,
without abolishing the basic pattern of tonic firing. Physiological roles of
different types of voltage-gated potassium channels were studied using
applications of respective blockers. It was found
that potassium conductance highly sensitive to external TEA (1 mM) or 4-aminopyridine (4-AP, 200 μM) is
responsible for fast repolarization and afterhyperpolarization of a single AP, providing the cells
with the ability for high-frequency firing. Potassium conductance sensitive to
α-dendrotoxin (α-DTX, 100 nM) did not play such a role. The known specificity of
these drugs strongly suggested that this 4-AP and TEA-sensitive conductance is
mediated by Kv3 potassium channels. The prominent role of Kv3 conductance was
also suggested by fast-spiking phenotype of the cells. Single-cell RT-PCR
experiments confirmed the expression of Kv3.1 and Kv3.2 mRNA
in the RGCs. Thus, in tonically
firing rat RGCs, TTX-sensitive Na+
and Kv3 K+ currents generate a basic firing pattern, while Ca2+
and Ca2+-dependent conductances only
moderately regulate discharge frequency.
Keywords: Shaw Potassium
Channels; Action Potentials; Drug effects; Whole-Cell Recordings; Patch Clamp Techniques;
Reverse Transcriptase Polymerase
Chain Reaction; Retinal Ganglion Cells.
1. Introduction
Retinal ganglion
cells (RGCs) are the only output neurons of the
retina of vertebrates. All electrical signals generated by photoreceptors are
transmitted by downstream retinal cells and eventually converge onto RGCs. Thus, the physiological function of RGCs is to receive synaptic inputs, to integrate them and
transmit the visual information to the central nervous system in the form of
trains of spikes.
Intrinsic
electrical properties of neurons play a very important role in this postsynaptic integration, so, the continuously updated
visual information transmitted to the brain by RGCs
is the result of interplay between the extrinsic synaptic inputs and their
intrinsic physiological properties. Thus, investigation of intrinsic properties
of RGCs is very important for understanding
mechanisms of processing and coding of visual information. A number of previous
studies examined the spike output and intrinsic membrane properties of RGCs of different species at various developmental ages
[2;8;10;11;17;18;23;29;33].
Some of these
reports indicate that intrinsic firing patterns of RGCs
could aid synaptic inputs in shaping light responses, and membrane properties of
the cells contribute to the functional differentiation of RGC types [18;29].
The task of
encoding spike activity derived from synaptic inputs is achieved through a
large array of voltage-dependent ion channels and respective conductances. At present time, a variety of these channels
and conductances have been described in RGCs by means of electrophysiological
recordings [1;10-12;26;28;30;34], immunohistochemistry
[22;35], in situ hybridization [22] and RT PCR [10;11;22]. Although
computational model of ganglion cell firing incorporating various voltage
dependent conductances have been generated [8], the
physiological role in spike activity encoding of many of these types of
channels expressed in RGCs is not absolutely clear.
Also there is a relatively small number of studies that were carried out on
retinal ganglion cells of mature mammals. However, comparison of the reports
concerning mature mammalian species with analogous reports concerning other
vertebrates shows serious distinctions between the species even in such
fundamental properties as intrinsic firing patterns of the RGCs
(compare reports concerning RGCs of mature cats or
rats, describing the sustained nature of the intrinsic spike generating
mechanism of almost all neurons [18;33] and analogous reports concerning RGCs of other non-mammalian vertebrates [11;17;29]. The
large part of the latter cells has transient (phasic)
nature of the intrinsic spike generating mechanism.). Also, excitability and
ionic conductances of RGCs
of mammals are changed dramatically during ontogenetic period [26;33]. Thus,
available data concerning roles of different types of conductances
in shaping firing patterns of RGCs of 5 days old mice
[23] could not be fully extended to describe these roles in more mature
mammals.
All above-mentioned
reasons make imperative to study intrinsic firing properties and ionic conductances underlying excitability of RGCs
of mature mammals.
The objective of
the present study was to characterize the intrinsic electroresponsive
properties of RGCs of mature (1 month old) rats. Our
study was carried out using the whole cell current-clamp recordings from RGCs within an isolated flat-mounted retina preparation.
The role of different types of ionic conductances
(sodium, calcium and different types of potassium) in shaping the definite
firing patterns of retinal ganglion cells were studied using applications of
pharmacological substances, which inhibited these conductances
selectively. Such approach allowed us to make conclusion about the physiological
role of TTX-sensitive sodium, voltage-gated calcium, and definite (Kv3) type of
potassium conductance in the RGCs of mature rat.
2. Experimental Procedure.
2.1 Retinal
preparation for electrophysiological recordings
Recordings were
made from cells in retinal flat-mounted preparations of one month old albino Wistar rats. Animals were killed by CO2 asphyxiation
and decapitation in accordance with the
Ukrainian Academy of Science Policy Statement concerning animal research.
The eyes were
enucleated and hemisected at the ora
serata. Each retina was isolated by peeling from the
pigment epithelium and finally separated from the eyecup with a cut at the
optic disk. Pieces of retina (3-12 mm2) were mounted, ganglion
cell layer up, on the bottom of the perfusion chamber coated with sylgard by pinning with needles (diameter 15 μm).
The chamber was mounted on the stage of an upright microscope (Olympus
BX 51 WI, Olympus Optical Co., Japan) equipped with 40´ water immersion
objective. All manipulations were performed in extracellular
solution (see below).
2.2 Electrophysiological
recordings
All recordings were
carried out in the chamber constantly perfusing with extracellular solution contained (in mM):
NaCl 140, KCl 3,
CaCl2 2, MgCl2 2, 4-(2-hydroxyethyl)piperazine-1-ethanesulfonic acid (HEPES) 10,
glucose 12, pH 7.35-7.41 (adjusted with NaOH).
The intracellular patch-pipette solution for whole cell recordings contained
(in mM): K-gluconate 100,
KCl 50, MgCl2 5, ethylene glycol-bis(2-aminoethylester)-tetraacetic acid (EGTA) 10, HEPES 20, pH 7.4
(adjusted with KOH). To attain whole cell access, the inner
limiting membrane overlying the recording area was removed by
brushing the retinal surface with the tip of a glass patch pipette
[18]. To do so, we advanced the tip of a patch pipette approximately into the
optic fibre layer and moved the pipette horizontally
and then vertically. Recordings were made from uninjured cells exposed during
the procedure. Whole cell recordings from the RGCs
were obtained by standard procedures using an intracellular amplifier
(Axoclamp-2B, Axon Instruments, Inc., USA). Initial pipette resistance ranged
between 5.5 and 10.5 MΩ. The pipette voltage in the bath was nulled prior to recording. Recordings were made in the
bridge current-clamp mode of the amplifier. All of the procedures and
recordings were performed at room temperature (t ~ 22°C) and under
relatively bright illumination with visible light. Such conditions presumably
caused the bleaching of the photopigment in the
photoreceptors [32] making the retina insensitive to the light. Pipette
resistance and capacitance were compensated by adjusting the bridge and
capacitance neutralization circuits of the amplifier prior to recording.
Voltage values
reported in this study have been corrected a posteriori for a liquid
junction potential of −10.7 mV, as calculated using Clampex 8.2 software (Axon Instruments, USA).
The “resting” (i.e.
steady-state because of maintained activity) potential was measured after the
whole cell recording configuration was established and rechecked periodically
throughout the recording period. Cells were excluded from analysis if their
resting potentials became depolarized substantially more than −50 mV.
For several cells
we recorded ongoing activity (i.e. firing evoked by intrinsic conductances and synaptic input only, holding current
was equal to zero in these recordings).
To evaluate
discharge properties of the cells, 500-ms depolarizing current injections were
used. Membrane potential of each cell was hyperpolarized
by steady current injection prior to the depolarizations.
This was done to minimize spontaneous firing (induced by synaptic input and
intrinsic conductances) between depolarizing current
injections, which was apparent in the majority of the cells, and to fully
cancel the inactivation of sodium conductance. All recordings, unless otherwise
specified, were made holding the neurons at interpulse
potential Vh ~ −80 mV
(Vh in no case was more negative than −90 mV).
Single action
potential (AP) amplitude (measured from AP threshold) in all cells, included
into this study, was never less than 55 mV under mentioned conditions.
Non-ganglion cells in the ganglion cell layer (displaced amacrine
cells) generally showed no spikes with such large amplitude [19;31]. The large
AP amplitude similar to large amplitude of the inward sodium currents [32;33]
suggested that each recording cell was RGC. Also, diameter of somas of
displaced amacrine cells in the rat are mainly
<10 μm [21], and we did not record from such small cells. An
existence of clearly detectable initial segment-soma-dendritic
(IS-SD) break (see Results) in majority of the cells in this study
strongly suggested presence of axon. Our pharmacological and single-cell RT-PCR
experiments were carried out only on tonically firing
neurons with the possibility to detect IS-SD break in ~ 90% of the cells.
Although we realize that very few subset of the cells in this study could be
displaced amacrine cells, we will refer to all the
cells as “ganglion cells” in the remaining text.
Membrane currents
and voltages were controlled and recorded with Digidata
1322A (Axon Instruments, USA) digitizer connected to a computer running pCLAMP8
software (Axon Instruments, USA). Current and voltage signals were sampled at
20 kHz, and analysis of these waveforms was performed using Clampfit 9.0 (Axon Instruments, USA) software.
In
most cases input resistance, membrane time constant, and whole cell capacitance
were estimated from the averaged (~100 episodes) low-amplitude electrotonic potential evoked by hyperpolarizing
current injections (500 ms, −5.. −100 pA).
The time course of this averaged electrotonic
potential was roughly exponential. Averaging of many episodes was especially
needed for those cells, which manifested prominent voltage fluctuations evoked
by synaptic input [2].
In some cases
prolonged dialysis for tens of minutes led to decrease of input resistance of
the cell. In some cells the decrease of input resistance accompanied with
negative shift of resting potential, presumably due to increase of membrane
permeability mainly to potassium. This phenomenon and rundown of currents led
to modifications of firing patterns decreasing the firing frequency. In a few
cases we even observed sustained spiking cells convert into a transient spiking
phenotype on prolonged dialysis, however, the reverse was never seen.
For this reason
input resistance was continuously monitored during experiment, and all
measurements after significant change (more than 50%) in input resistance were
discarded.
In a few cases we
observed a sudden increase of access resistance, which led to significant
change in electrotonic potential and reduction of AP
amplitude. Such recordings were rejected from the present analysis.
We tested each cell
with a series of depolarizing 500-ms current steps. Current strength was
increased at small increments. Increment was chosen individually for each cell
to record firing patterns at different stimulus strength. If the increment was
too small, we observed almost identical firing patterns at several consecutive
stimuli. In those cases increments were increased. Thus, the current increments
used in our experiments were in the very broad range (from 5 pA to 100 pA) due to different
input resistances of the cells. The interval between
current steps was 6 seconds in all experiments.
Single AP shape
parameters were measured from first spikes evoked by near-threshold depolarizations from Vh ~ −80 mV
(in some cases just-suprathreshold current steps
evoked spike bursts then we measured shape parameters of the first AP in the
burst). We determined such AP shape parameters: threshold (mV), amplitude (mV),
overshoot (mV), undershoot (mV), afterhyperpolarization
(mV), depolarization and repolarization rates
(mV/ms), width (ms).
AP threshold was
measured as the inflection point in the voltage trajectory preceding the AP,
where the membrane presumably becomes strongly regenerative [17]. This
inflection point was determined on inspection of the first time derivative of
the voltage waveform. Inflection point was determined as the point, at which
the first derivative exceeded its maximal noise value in the period preceding
AP onset (this value was ~10 mV/ms). Practically, this method found the
potential at the moment of activation of regenerative inward sodium current,
because the first derivative of voltage waveform is proportional to the transmembrane current charging the membrane I = C(dV/dt). AP
overshoot was determined as the value of potential at the AP peak. AP amplitude
was calculated as the difference between the peak and the threshold of the AP.
AP undershoot was measured as the voltage minimum following AP peak. AP afterhyperpolarization was calculated as the difference
between this minimum and the threshold of the AP. Depolarization and repolarization rates of the AP were computed
from the maximum and minimum of the first derivative of the
voltage waveform. AP width was measured at half the AP amplitude.
Tonically firing neurons
generated repetitive discharges that lasted for the duration of the 500-ms
depolarization period in response to stimulating current in the certain range.
We referred to this range of stimulating current as to tonic range. Each cell
had its own such range. Larger depolarizing current steps drove the cells into
spike block within the pulse (some cells generated low-voltage (<30 mV)
oscillations at the end of the stimulus in response to such stimulations;
these oscillations were not considered as spike generation). Smaller
depolarizing current steps did not evoke tonic firing (they could evoke only
transient or very irregular spike trains). Instantaneous frequency
(1/interspike interval) was computed from trains of spikes. RGCs tested generally showed some spike frequency
adaptation during depolarizing current steps. This adaptation occurred mainly
at the first 100-200 ms of the stimulus, so we computed steady-state firing
frequency (Hz) for tonic discharges as the average of instantaneous
frequency for the last 100 ms of a stimulus. Steady-state firing frequency was
larger for larger stimuli in tonic range, so, for each cell we computed maximal
steady-state firing frequency from the spike train, evoked by the current
strengths close to maximal in tonic range (see Figure).
Active substances were dissolved as stock
solutions at not less than 100 times the final concentration, diluted in extracellular medium just before use and superfused through the bath. Perfusion chamber volume was
0.9-1.2 ml, so we superfused 12-20 ml of new solution
for solution exchange.
All blockers were purchased from Sigma (USA).
Student’s t-test
was used for statistical data comparison. Unless otherwise specified, error
measurements are reported as S.E.M.
2.3 Single-cell
RT-PCR
Methods for single-cell
RT-PCR with two rounds of amplification were similar to those described
previously [15]. Patch-pipettes used for RT-PCR experiments (5.5-9 MΩ)
were filled with the standard intracellular solution (see above, volume –
3 μl). Every RGC selected for analysis was primarily subjected to electrophysiological recordings in order to test the
ability of the cell for tonic firing. Then, the cellular cytoplasm was sucked
off by applying negative pressure (suction time – 1.7-8 minutes). We increased
the rate of extracellular solution perfusing during this manipulations to reduce
contamination. Extracellular solution instead of
cellular cytoplasm was sucked off at the same conditions near the cells to
control possible contaminations (see below). The
harvested material from an individual retinal ganglion cell was blown into a
test tube containing 0.5 μg random hexamer
primers (0.5 μg/μl, Promega), 8 U of RNase inhibitor Ribolock
(40 U/μl, Fermentas), 5.8 μl
nuclease-free water (Fermentas) and stored on ice (or
frozen) until use.
Then, this mixtures
were heated to 70° C for 5 min and immediately cooled on ice. After addition of
each of the four nucleotide triphosphates (dNTPs, Promega; final
concentration – 1 mM), 20 U Ribolock,
200 U of RevertAidTM M-MuLV Reverse Transcriptase (200
U/μl, Fermentas), 4 μl of 5X reaction
buffer (Fermentas) the reverse transcription was
carried out for 5 min at 25° C, 60 min at 42° C, 10 min at 70° C in a
final volume of 20 μl.
Then, the
single-stranded cDNA mixture of individual RGC were
divided into two parts (9 μl each) and used for separate two-round PCRs for amplification of Kv3.1 and Kv3.2 potassium channel
nucleotide sequences. The first round was performed in the final volume of
50 μl containing: 9 μl of the cDNA
mixture, 0.8 μM gene-specific primers (see below), 5 μl 10X Taq buffer (750 mM Tris-HCl, pH 8.8, 200 mM
(NH4)2SO4, 0.1% Tween
20; Fermentas), 1.5 mM MgCl2,
40 μM of each of the four dNTPs, 1.5 U of
recombinant Taq DNA Polymerase
(5 U/μl, Fermentas). The second round was
carried out in the final volume of 25 μl containing: 3 μl of the
first round template, 0.8 μM primers (see below), 2.5 μl 10X Taq buffer, 2 mM MgCl2,
0.2 mM of each of the four dNTPs, 0.9 U of recombinant Taq
DNA Polymerase.
Primers in the two
rounds of amplification were nested and intron-overspanning.
Primer sequences and locations (referring to published sequences in GenBank of the National Center for Biotechnology
Information, ncbi.nlm.nih.gov) were
as follows [15]: Kv3.1 (accession number X62840):
Upper primer, 5'-CAA GAG ATT GGC GCT CAG TGA C-3' (742-763); lower primer,
5'-CCC AG(AG) GCC AG(AG) AAG ATG AT(AC) AGC A-3' (1326-1350); lower nested
primer, 5'-AA(AG) TGG CG(GT) GT(ACG) AGC TTG AAG AT-3' (1247-1269). Kv3.2 (M59211):
Upper primer, 5'-TTG AGG ATG CTG CGG GGC TGG-3' (611-631); lower primer, same
as for Kv3.1 (1187-1211); lower nested primer, same as for Kv3.1 (1108-1130).
The primers were ordered from Sigma.
The cycling
conditions for both rounds were: 95° C for 3 min, after a hot start, 35 step
cycles (95° C for 30 sec, 57° C for 30 sec, 72° C for 45 sec),
and 72° C for 10 min. Positive controls for all reactions were run
using thalamic RNA (kindly provided by Oleksiy Boldyryev, International Center for Molecular Physiology, Kyiv, Ukraine), in view of strong expression of Kv3.1 and Kv3.2
transcripts in different thalamic nuclei [24]. Two controls for possible
contamination artifacts were performed using water and extracellular
solution instead of template for each RT-PCR amplification. Negative controls
gave negative results.
3.
Results
3.1 Basic electrical
properties of rat RGCs
The overall sample of retinal ganglion cells
from which recordings were made in the current clamp mode contained 85 neurons
obtained from 39 animals. For all these cells we estimated resting potential,
then obtained firing patterns at different stimulus intensities and measured AP
shape parameters and firing frequencies. For 79 cells in our sample we also
estimated capacitances, membrane time constants and
input resistances. All these values with respective ranges
are listed in table 1.
Estimations for passive membrane parameters and
some of AP shape parameters varied in the broad ranges and did not follow a
normal distribution (Table 1, see also histograms 1 and 2). This was an apparent
indication that our recordings were made from RGCs of
different types (see Discussion).
|
|
Mean ± S.E.M. |
Range |
P (Shapiro-Wilk
normality test) |
Number of the cells |
Resting (steady-state) potential |
−61.6 ± 0.7 mV |
−50 mV to −78 mV |
|
n = 85 |
|
Input resistance |
0.36 ± 0.03 GΩ |
0.06 to 1.93 GΩ |
P < 0.0001 |
n = 79 |
|
Membrane time constant |
19.1 ± 1.2 ms |
5.3 to 53.5 ms |
P < 0.0001 |
n = 79 |
|
Whole cell capacitance |
66 ± 3 pF |
10.7 to 175.3 pF |
P < 0.01 |
n = 79 |
|
AP shape parameters: |
|
|
|
|
|
Threshold |
−58.5 ± 0.8 mV |
−39.1 to −74.5 mV |
|
n = 85 |
|
Amplitude |
92.1 ± 1.2 mV |
55.6 to 114.7 mV |
P < 0.01 |
n = 85 |
|
Overshoot |
33.4 ± 1.0 mV |
3.6 to 52.3 mV |
P < 0.001 |
n = 85 |
|
Afterhyperpolarization |
−10.5 ± 0.9 mV |
−31.7 to 13.4 mV |
|
n = 85 |
|
Undershoot |
−69.0 ± 0.6 mV |
−81 to −54.1 mV |
|
n = 85 |
|
Width |
0.85 ± 0.03 ms |
0.43 to 1.52 ms |
P < 0.0001 |
n = 85 |
|
Depolarization rate |
276 ± 13 mV/ms |
92.6 to 557.4 mV/ms |
P < 0.01 |
n = 85 |
|
Repolarization rate |
−147 ± 6 mV/ms |
−51.5 to −277.6 mV/ms |
P < 0.05 |
n = 85 |
|
Maximal steady-state
firing frequency (for tonically firing neurons) |
63 ± 3 Hz |
12.3 to 124.2 Hz |
|
n = 80 |
Table 1. Electrophysiological
characteristics of rat RGCs. The distributions of
that values were tested using Shapiro-Wilk normality
test. For the values that did not follow the normal distribution the value of P
is indicated in the table. Note that few cells (n = 6, i.e. 7.0%) had
a depolarized value of undershoot relative to value of threshold. The
calculated value of the difference between the undershoot and the threshold of
the AP was positive for such cells, nevertheless, we also refer to this value
as to “afterhyperpolarization”. All values for AP
shape parameters were calculated for APs evoked from Vh ≤ −80 mV.
Single APs of the neurons studied were characterized by a short AP
width (Table 1). The numerical time derivative of voltage waveform allows to
detect the IS-SD break (see figures 2B, 3B). This feature was an indication
that these spikes recorded at the soma were initiated on neighboring membrane
with a lower threshold (axon initial segment membrane [5;27]). We could detect
the IS-SD break at least in some of spikes in majority of the cells included
into this study (86%).
The majority of RGCs
(94.1%) displayed sustained spike trains that lasted throughout the stimulus
period in a certain range of current stimulus intensity (see figures 2A, 3A,
6A; also see figure B). All
analyses of firing properties, including the experiments with drug application
were performed only on these tonically firing
neurons.
Tonically
firing neurons were generally characterized by high maximal steady-state firing
frequency (Table 1). Maximal steady-state firing frequencies were larger
than 50 Hz in majority of RGCs (Fig.1). So, most
of them could be definitely classified as fast-spiking neurons [4;7;13].
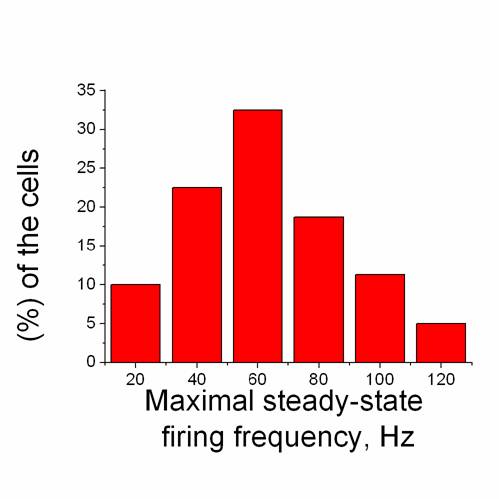
Fig. 1. Histogram of tonically firing RGCs maximal
steady-state firing frequencies (n = 80). Note
that maximal steady-state firing frequencies were larger than 50 Hz in
67.5% (54/80) of the tonically firing RGCs (or 63.5% (54/85) of the all 85 ganglion cells recorded)
and their maximum observed in our experiments reached the value of
124.2 Hz.
Only few (n = 5, i.e. 5.9%)
recorded RGCs were not capable of repetitive firing
throughout a depolarizing current pulse (phasic
cells) (see figure A). These
cells did not display sustained firing even when stimulus intensity was varied
in very small increments (2 pA, n = 4).
However, capacitance and other electrophysiological
parameters of phasic neurons (AP shape parameters,
passive membrane parameters) were in the same range as of tonically
firing cells (see table).
3.2 Prehyperpolarization-evoked
effects
We prehyperpolarized the cells to ~ −80 mV to prevent firing
between the current steps (see Experimental Procedure). However, in some
tonically firing neurons it caused recognizable
effects after termination of the prehyperpolarization,
which could be clearly distinguished in firing patterns recorded at the
beginning of stimuli. These were “rebound
excitation” [12;14;17] and “ramping” [18].
Varying Vh in
the range from resting potential to ~ −80 mV showed, that rebound
excitation had the pronounced influence on spike output at the beginning of the
depolarizing current step, however, did not profoundly change the maximal
steady-state firing frequency of the cells, calculated at the end of the
stimulus (changed by 2 ± 10%, n = 5, P = 0.9)
(see figure A). We calculated
the shape parameters of a first rebound spike for such cells as their AP shape
parameters.
Ramping was clearly
exhibited only by a very small subset of tonically
firing neurons. However, this phenomenon also seemed to influence the spike
output at the beginning of the stimulus without prominent influence on the
maximal steady-state firing frequency, calculated at the end of the 500-ms
current step (see figure B).
According to the
firing patterns recorded, we estimated the percentage of the cells with rebound
excitation and ramping as 37.5% (30/80) and 7.5% (6/80) of tonically
firing ganglion cells.
All experiments
with variation of Vh (n = 10)
showed that prehyperpolarization to ~ −80 mV
did not abolish the ability of tonic cells for sustained firing at some of the
applied stimuli. Few phasic cells also did not change
the intrinsic nature of their firing with variation of Vh.
3.3 Potassium conductances
An ability to fire
spikes at high frequencies is commonly associated with expression of Kv3
potassium channels in neurons [13;24;25]. Kv3 channels are blocked by low
concentrations of external tetraethylammonium (TEA)
or 4-aminopyridine (4-AP) (Kv3.1-Kv3.2 channels half-maximal inhibitory
concentrations (IC50) are not exceeding 0.2 mM
for TEA and 0.1 mM for 4-AP [9]). We applied both of
these substances to investigate the role of Kv3 conductance in the RGCs.
Bath application of
1 mM tetraethylammonium
chloride (TEA) or 200 μM 4-aminopyridine (4-AP) produced the same
profound changes in AP shape and repetitive firing properties of the cells
(Fig. 2A, B; 3A, B). Maximal steady-state firing frequency was decreased after application of TEA or 4-AP, so
fast-spiking phenotypes of neurons was converted into a substantially slower
spiking mode after addition of these drugs (Fig. 2A, 3A;
Table 2).
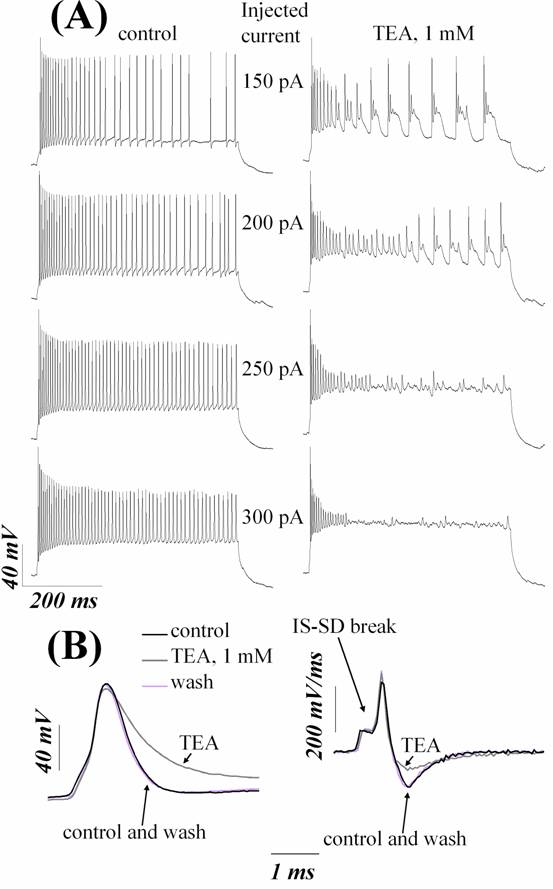
Fig. 2. Tetraethylammonium (TEA; 1 mM) impairs AP repolarization and slows high-frequency firing of RGCs. (A) left panel shows repetitive firing of RGC under control conditions. Right panel shows the responses to identical currents in the presence of 1 mM TEA. TEA profoundly reduced the steady-state firing frequency for the all intensities of stimulating currents. Amplitudes of stimulating current steps are indicated near each pairs of traces. Holding current –220 pA. (B) 1 mM TEA caused AP broadening of a neuron by reducing repolarization rate and suppressed afterhyperpolarization of single APs evoked by near-threshold depolarizations. Left panel shows voltage waveform. Right panel shows numerical time derivative of this waveform. The initial segment-soma-dendritic (IS-SD) break is indicated by arrow. (A) and (B) are from different cells.
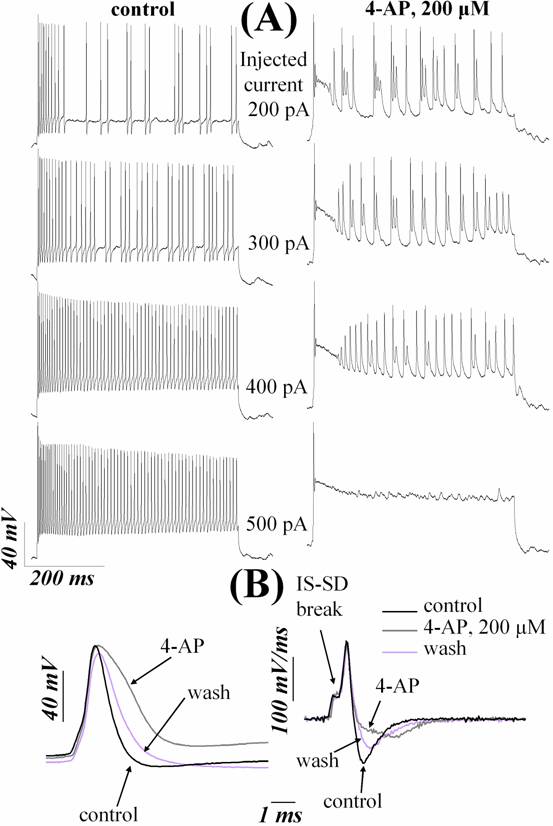
Fig. 3. 4-aminopyridine (4-AP, 200
μM) impairs AP repolarization and slows
high-frequency firing of RGCs. (A) left panel shows
repetitive firing of RGC under control conditions. Right panel shows the
responses to identical currents in the presence of 200 μM 4-AP. 4-AP
profoundly reduced the steady-state firing frequency for the all intensities of
stimulating currents, which are indicated above each pairs of traces. Holding
current –210 pA. (B) 200 μM 4-AP caused AP
broadening of a neuron by reducing repolarization rate and suppressed afterhyperpolarization of single APs
evoked by near-threshold depolarizations. Left panel
shows voltage waveform. Right panel shows numerical time derivative of this
waveform. IS-SD break is indicated by arrow. (A) and (B) are from different
cells.
TEA and 4-AP also
profoundly changed single AP shape by influencing the repolarization
and afterhyperpolarization without compromising AP
threshold and depolarization (Fig. 2B; 3B). Afterhyperpolarization
was eliminated nearly completely after addition of these drugs. Absolute value
of repolarization rate was substantially decreased
after application of TEA or 4-AP. The apparent increasing of the AP width was
due to reduction of repolarization rate, because
other AP shape parameters (depolarization rate and threshold) did not change
significantly after application of TEA or 4-AP. The values for electrophysiological parameters of the cells in control and
after application of TEA or 4-AP are listed in Table 2.
|
|
Control |
TEA, 1 mM |
Changed by, % |
Control |
4-AP, 200 μM |
Changed by, % |
|
Maximal steady-state firing frequency |
67 ± 7 Hz |
25 ± 6 Hz |
–59 ± 11%** |
65 ± 15 Hz |
24 ± 5 Hz |
–59 ± 6%*** |
|
Single AP shape parameters: |
|
|
|
|
|
|
|
Threshold |
–64 ± 2 mV |
–64.1 ± 1.9 mV (P = 0.7) |
|
–54 ± 3 mV |
–62 ± 5 mV (P = 0.1) |
|
|
Depolarization rate |
322 ± 55 mV/ms |
328 ± 47 mV/ms |
+4 ± 4% (P = 0.3)
|
233 ± 56 mV/ms |
242 ± 59 mV/ms |
+4 ± 8% (P = 0.7) |
|
Repolarization rate |
–163 ± 29 mV/ms |
–87 ± 10 mV/ms |
–42 ± 6%*** |
–152 ± 29 mV/ms |
–87 ± 24 mV/ms |
–46 ± 6%*** |
|
Width |
0.84 ± 0.15 ms |
1.12 ± 0.13 ms |
+41 ± 12%* |
0.77 ± 0.10 ms |
1.3 ± 0.2 ms |
+69 ± 20%* |
|
Afterhyperpolarization |
–3 ± 3 mV |
11 ± 4 mV* |
|
–19 ± 3 mV |
1 ± 5 mV** |
|
|
Undershoot |
–66.9 ± 1.3 mV |
–53 ± 3 mV* |
|
–72.4 ± 1.6 mV |
–61 ± 2 mV *** |
|
Table 2. Effects of 1 mM TEA
or 200 μM 4-AP on the firing patterns and single AP shape of RGCs. Values are means ± S.E.M, n = 6
for TEA and n = 6 for 4-AP. * P < 0.05,
** P < 0.01, *** P < 0.001.
Paired t-tests for values of potentials (control/blocker),
one sample t-tests for changes (in %) of depolarization and repolarization
rates, maximal steady-state firing frequencies and widths. For values that did
not change significantly the value of P is indicated.
The same 4-AP or TEA-induced effects were
apparent in all cells studied (even in cells with maximal steady-state firing
frequency lower than 50 Hz). So we concluded that 4-AP and TEA-sensitive
channels are expressed in all or at least in large majority of tonically firing RGCs.
Pharmacological specificities of 4-AP and TEA are not limited to Kv3
potassium channels. Few other known K+ channels are also
significantly inhibited by these drugs in our concentrations (see Discussion).
The similar sensitivity to 4-AP and TEA also have Kv1.1 channels (IC50 ~
0.3 mM for TEA and 290 μM for 4-AP [9]).
However,
application of α-dendrotoxin (α-DTX)
(100 nM, n = 5) (IC50 ~ 20 nM for Kv1.1 channels [9]) never resulted in changes
similar to 4-AP or TEA-evoked (see
figure).
The single-cell
RT-PCR experiments confirmed the expression of Kv3 channels in the RGCs. Kv3 mRNA was detected in
each of the 9 tonically firing cells studied: in 3
cells we detected both Kv3.1 and Kv3.2 mRNA, in 3
cells only Kv3.1 mRNA, and in 3 cells only Kv3.2 mRNA (Fig. 4).
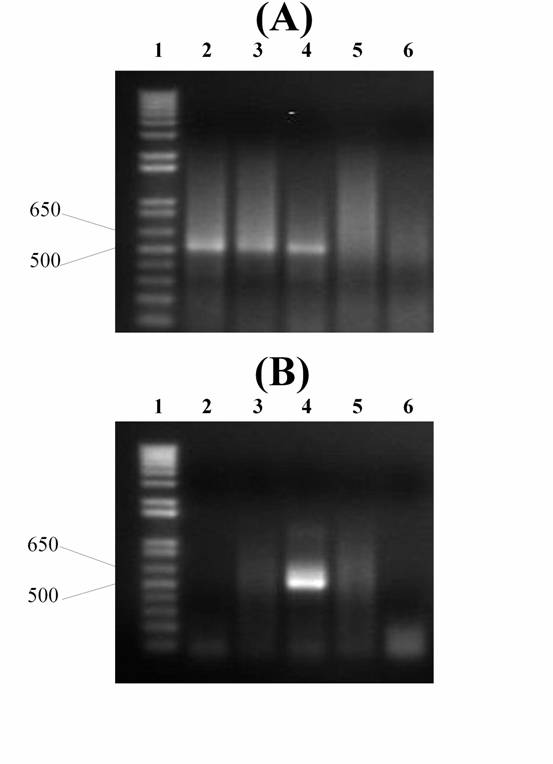
Fig. 4. Single-cell RT-PCR
amplification of Kv3.1 and Kv3.2 potassium channels using reverse-transcribed mRNA aspirated from an individual retinal ganglion cell of
rat immediately after electrophysiological recording.
Fragment sizes of PCR products were determined from the accompanying DNA ladder
(lane 1). (A) and (B) are from the same cells aspirated during one experiment.
(A) Kv3.1 amplification; (B) Kv3.2 amplification. For (A) and (B): lane 2 – the
first cell (maximal steady-state firing frequency – 43.5 Hz); lane 3 – the
second cell (frequency – 79.9 Hz); lane 4 – the third cell (frequency – 58.4
Hz); lane 5 – negative control (outside) (see Materials and methods); lane 6 –
negative control (water) (see Materials and methods).
We also analyzed
the influence of TEA on ongoing activity. We selected 4 cells which exhibited
frequent ongoing spiking for our analysis. The mean interval between ongoing
spikes, calculated from our recordings (duration – 30 seconds), lied in the
range from 28.4 to 107.8 ms for these cells. The minimal interval between
the spikes was in the range from 11.2 to 13.9 ms for the cells. The mean
interval between spikes was significantly increased (by 102 ± 13%,
n = 4, P < 0.01) after addition of 1 mM TEA (Fig. 5). Thus, cells exhibited frequent ongoing
firing needed Kv3 conductance to maintain this firing.
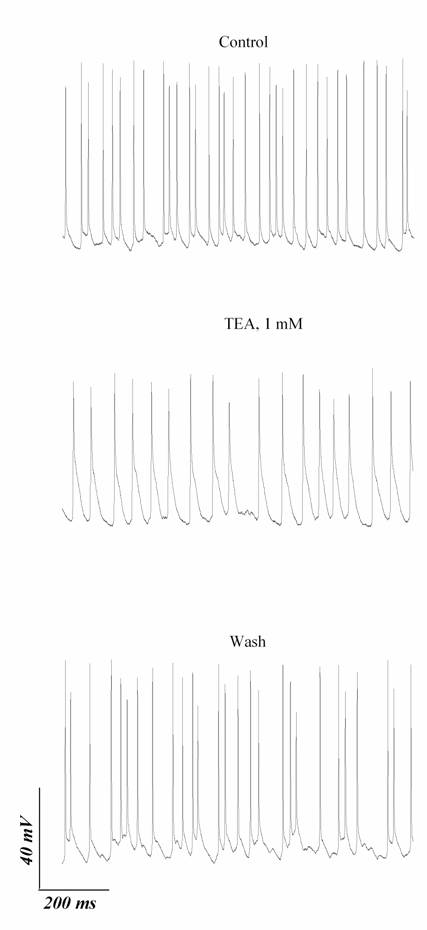
Fig.
5. Influence of tetraethylammonium (TEA; 1 mM) on
ongoing activity of RGC. The traces in control, in the presence of TEA and on
washout were obtained without stimulation. Holding currents were equal to zero
in these experiments.
3.4 Inward conductances
Inward conductance
of RGCs is mediated by TTX-sensitive sodium and
voltage-activated calcium channels [26;33].
Blocking of sodium
conductance by TTX (1 μM, n = 4) caused complete and
reversible block of spike generation (see figure).
Suppression of Ca2+
influx through voltage-activated Ca2+ channels by Cd2+ (200 μM,
n = 6) did not abolish the basic pattern of tonic firing (Fig. 6A).
Maximal steady-state firing frequency did not change significantly (changed by
9 ± 7%, n = 6, P = 0.25). However, we
found certain moderate modifications of firing patterns when comparing spike
trains evoked by the same stimulus in tonic range before and after application
of cadmium. Only the cells (n = 4) with very stable recording were
selected for such analysis (i.e., we selected only the cells with the input
resistance fluctuations during experiment less than 15%). The spike trains in
cadmium generally had larger steady-state firing frequency than in control
(Fig. 6B). We computed the percent of stimulation intensities at which the
increase of steady-state firing frequency was observed for each cell. Mean
value of this percent was 88 ± 8% (n = 4). This value was
significantly (P < 0.05, n = 4, Student’s t-test)
higher than 50%, so we concluded that this increase was not due to random
fluctuation of frequency. The same increase of frequency was apparent at the
beginning of the stimulus-evoked spike trains (the analogous percent for
instantaneous frequency, calculated for the first interspike
interval was 91 ± 3%, n = 4, P < 0.001
vs. 50%, data not shown). Thus, after calcium influx suppression we did not
find the significant increase of maximal steady-state firing frequency
calculated at the strongest stimulations, however the
moderate increase of this frequency at majority of intensities in tonic range
was apparent.
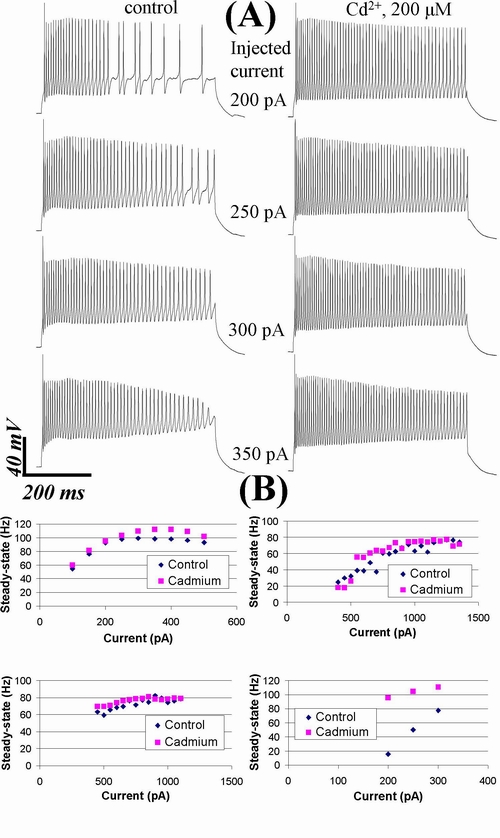
Fig.
6. Influence of cadmium (Cd2+,
200 μM) on RGCs firing pattern. (A) Cd2+ did
not abolish the basic pattern of tonic firing. Left panel shows repetitive
firing under control, right panel – in the presence of Cd2+. Holding
current –60 pA. (B) Increase of steady-state firing
frequency was observed at majority of stimulation intensities in tonic range
for all 4 cells studied. These graphs (1-4) represent plots of the steady-state
firing frequency as function of injected current for these 4 cells. Graph 4
represent the cell in A. Graphs 2 and 3 represent cells with strong tonic
synaptic activity, which could also be affected by Cd2+ due to
suppression of calcium influx in presynaptic cells.
Cd2+ also
significantly changed single AP shape: repolarization
rate was significantly increased (by 17 ± 5%, P < 0.05,
n = 6). A significant decrease of AP width (by 9 ± 2%, P < 0.05,
n = 6) was mainly due to increase of repolarization
rate, because depolarization rate did not change significantly (changed by
3 ± 5%, n = 6, P = 0.55). Mean values were
changed from −180 ± 18
to −210 ± 20 mV/ms
(repolarization rate) and from 0.67 ± 0.06
to 0.60 ± 0.05 ms (width) after application of Cd2+
(n = 6).
4. Discussion
4.1 Diversity of RGCs electrical properties can be partly explained by
existence of different RGC types
Retinal ganglion cells
of rat are divisible into some types, differing in their receptive field
properties and morphology [20;21]. In this work we did not investigate the
morphological features of the neurons recorded. However, some data pointed out
that recordings were made from cells of different types. As it was shown for
cat [18], retinal ganglion cell types are clearly different in their input resistances in more than 30 times (1048 MΩ for zeta cells vs 31.3 MΩ for
alpha cells). O`Brien and colleagues observed marked
differences (in order of magnitude) among different cell types in the membrane
time constants. Single AP width also differed among morphological types
according to this report.
Therefore our data
(which showed the striking differences in whole cell capacitances,
input resistances, membrane time constants, and some
of the single AP shape parameters between different cells) could be explained
by recording from different types of RGCs, which
(similar to different RGC types of cat) have different electrophysiological
properties.
In our recordings
two types of firing patterns were clearly distinguishable: the most of the
neurons were tonic cells, also there were few phasic
cells. Other studies also showed that tonically
firing neurons constitute the overwhelming majority of mature mammalian RGCs [18;33]. On the contrary, the large subset of mature RGCs of different non-mammalian vertebrate species are phasic neurons [11;17;29].
Single APs of RGCs were characterized by
short width and apparent in majority of the cells initial segment – soma-dendritic break. The existence of IS-SD break could be
explained by the fact that retinal ganglion cells had a sharply defined region
of high sodium channel density at the axon initial segment (including axon
hillock), responsible for spike initiation in these neurons [35]. Short width
of RGC APs could be explained by the fast repolarization, which was highly sensitive to blockers of Kv3 channels.
4.2 Conductances, which could be activated only after preceding
hyperpolarization, manifested themselves only in some
subsets of RGCs
In some subsets of tonically firing neurons we observed the marked influence
on firing pattern by conductances, which could be
activated only after preceding hyperpolarization. It
is important to note that hyperpolarization used in
this study was close to −80 mV, and we did not study the effect of
more stronger pre-hyperpolarizations.
Mitra and Miller [17]
suggested that the phenomenon of rebound excitation was caused by two types of
channels: LVA Ca2+ channels and hyperpolarization-activated
cation (HCN) channels, mediating Ih
current. The evidence of importance of Ih
channels for firing the rebound bursts in rat RGCs
was found by Lee and Ishida [12]. Recent reports [14;18] elucidated, which
types of mammalian RGCs fire rebound bursts.
The phenomenon of
ramping was studied on mature mammalian RGCs earlier
[18] and was suggested to be mediated by slowly inactivating K+ current
termed IB. This current activates rapidly at voltages subthreshold for spike generation and inactivates very
slowly over hundreds of milliseconds, and is similar to another current (ID),
originally described in hippocampal cells. These “D”
or “B” channels are probably various combinations of Kv1.2 (or Kv1.1 or Kv1.6)
with other Kv1 proteins and Kvβ subunits [3]. Similar to O’Brien and colleagues [18] we
observed ramping only in small subset of RGCs.
4.3 Kv3
potassium conductance shapes single AP repolarization,
afterhyperpolarization and promotes high-frequency
repetitive firing in RGCs of rat
Tonically firing RGCs of rat exhibited high steady-state firing frequency.
Comparison of our data with recordings from fast-spiking neocortical
interneurons [7] led to observation that 63.5% of the RGCs had the maximal
steady-state firing frequency larger than 50 Hz and, hence, are comparable
with fast-spiking interneurons by this parameter
(which also had lower bound of 50 Hz for this frequency). Further
comparison showed that mean maximal steady-state firing frequency of
fast-spiking interneurons (123.2 ± 11.1 Hz)
fell within the range of maximal steady-state firing frequencies of the RGCs (up to 124.2 Hz).
That is
why we could definitely classify most of the recorded cells as fast-spiking
neurons [4;7;13].
This
conclusion led to assumption that RGCs express Kv3
potassium channels, which are necessary and sufficient for the fast-spiking
phenotype of many different types of neurons [6;7;13;15;16;24;25].
We
tested this assumption using application of two drugs: 4-AP (200 μM)
and TEA (1 mM), either of which inhibits Kv3
conductance in concentrations indicated [3;6;7;9;13;15;16;24;25]. The profound
effects of these drugs on AP shape and repetitive firing added the evidence
that RGCs indeed express Kv3 conductance, which
mainly shapes the repolarizations and fast afterhyperpolarizations of APs,
providing the RGCs with ability for high-frequency
spike generation.
Used concentration
of TEA produces significant inhibition of only a few other known K+ channels.
These include the following channels (with IC50 or Kd indicated): large-conductance Ca2+ activated
K+ channels, containing proteins of the slo
family (80-330 μM), Kv 1.1 channels
(0.3 mM), and KCNQ2 (0.16-0.5 mM) [3;7;9;24;25]. However, these channel types can be
distinguished from Kv3 by other pharmacological properties.
Ca2+ activated
K+ channels, containing proteins of the slo
family, were suppressed in our experiments by blocking the Ca2+ influx
through voltage-activated Ca2+ channels by application of Cd2+
(200 μM). These applications did not produce effects, which were in
any way similar to the TEA-evoked profound changes.
Since KCNQ2 subunits form very slowly activating and deactivating
channels (time constants of hundreds of milliseconds to seconds) which would
not be significantly activated during single APs,
their blocking could not produce changes similar to the TEA-evoked [3;7;24].
Also, KCNQ2 and slo channels are not blocked even by large concentrations
of 4-AP (KCNQ2 are not blocked by 2 mM 4-AP [3]; also
5 mM of 4-AP do not block calcium-activated potassium
channels in RGCs of rat [1]). However, application of
4-AP (200 μM) in our experiments caused effects very similar to
TEA-evoked.
To test the
possible involvement of Kv1.1 channels we applied a toxin specific for several
Kv1 channels (α-DTX). However, application of α-DTX also did not
produce effects, which were in any way similar to the TEA or 4-AP-evoked
profound changes.
These results
support the hypothesis that Kv3 potassium channels are expressed in tonically firing RGCs and they
powerfully shape APs and repetitive firing properties
of these neurons. Our single-cell RT-PCR experiments confirmed the expression
of Kv3 channels in the RGCs. Interestingly, we found
that different cells expressed different (Kv3.1, Kv3.2, or both) mRNA, however, we detected at least one of these
transcripts in each of the cells tested.
The evidence for
the expression and importance of Kv3 channels for RGCs
tonic firing can be summarized in the following order: 1) The majority of tonically firing RGCs exhibited
clear fast-spiking phenotype. Kv3 channels have unique biophysical properties
necessary to enable repetitive firing at high frequencies [13]. No data are
available indicating that there are alternative solutions in neurons to achieve
high-frequency repetitive firing [25]. 2) The pharmacological properties of
potassium conductance mainly responsible for tonic firing in the recorded cells
fully resembled the pharmacological properties of Kv3 channels in heterologous expression systems. 4) Effects of Kv3-like
conductance suppression in RGCs was highly similar to
effects of blocking of Kv3 channels in other neurons [6;7;15;16;24]. 5). Our
single-cell RT-PCR experiments confirmed the expression of Kv3 channels in the RGCs.
Increase of ongoing
firing interpulse intervals, which were observed in
our experiments after application of TEA, suggested that Kv3 conductance
contributes to the ability of RGCs to preserve the
timing information contained in sensory signals. Such a role of Kv3 conductance
suggested earlier for auditory neurons, distributing the auditory signals
[24;25], and for “pump” neurons of the nucleous tractus solitarii, distributing
the lung inflation signal throughout the appropriate circuitry [6]. Thus, we
might conclude that many types of sensory neurons use Kv3 conductance in order
to transmit the high-frequency sensory signals faithfully.
Thus, utilizing
biophysical, pharmacological, and single-cell RT-PCR approach, we have shown
the prominent role of Kv3 conductance at least in large majority of rat RGCs. This conductance is mediated mainly by Kv3.1 and
Kv3.2 subunits, because they promote high frequency
firing, whereas inactivating Kv3.3 and Kv3.4 subunits
does not promote it [13;24]. Also, the reported IC50 values shows
weaker sensitivity of Kv3.3-Kv3.4 channels to 4-AP (IC50 ~ 1.2
mM for Kv3.3 and 0.5-0.6 mM
for Kv3.4 [3;9]).
Expression of
mammalian homologues of Kv3 subunits was recently
shown for majority of RGCs of mature trout [10;11].
However, recent report [19] showed that only a very few RGCs
of mature mice express Kv3.1 and Kv3.2 subunits.
These negative results were obtained by immunohistochemical
approach only. The report of Ozaita and colleagues
[19] definitely conflicts with our data, because in our experiments the
majority of the cells have the ability for high-frequency firing, all cells
studied have the high sensitivity to Kv3 channels blockers,
and all cells studied were Kv3-positive. It is unlikely that this discrepancy
is caused by species differences between different rodents.
4.4 Each of the
depolarization-activated conductances has its own
role in shaping RGC firing pattern
Our data also
suggested the physiological roles of two types of known inward
depolarization-activated conductances in RGCs: TTX-sensitive sodium [33] and voltage-activated
calcium [26] conductances.
We concluded that
depolarizing phase of AP is generated by TTX-sensitive sodium conductance,
large part of which is localized in axon initial segment, while Ca2+ currents
influenced significantly the repolarizing phase of
AP, slowing the repolarization.
The increase of the
steady-state firing frequency observed in our experiments after application of
Cd2+ could be caused not only by suppression of Ca2+ current
in itself, but also by suppression of Ca2+ -activated
potassium conductance [34]. It is important to note that calcium conductance in
RGCs is changed profoundly during development [26].
This can be the reason why our data indicating only regulatory role of calcium
currents in shaping RGCs firing patterns was
different from the data of Rothe and colleagues, who
studied RGCs of immature mice. Analogous experiments
with suppression of calcium conductance by cadmium led to block of sustained
repetitive discharge in the retinal ganglion cells of 5 days old mice [23].
Thus, we conclude
that 1) the basic pattern of RGCs tonic firing is
generated by TTX-sensitive sodium and Kv3 potassium conductance 2) Ca2+ and
Ca2+ -dependent conductances only
moderately stabilize tonic firing, often decreasing discharge steady-state
frequency, and moderately influence single AP shape 3) Kv3 conductance
contributes to the ability of RGCs to preserve the
timing information contained in high-frequency visual signals.
1. Akamine,T., Nishimura,Y.,
Ito,K., Uji,Y., and Yamamoto,T., Effects of haloperidol
on K(+) currents in acutely isolated rat retinal ganglion cells, Invest Ophthalmol. Vis. Sci., 43 (2002) 1257-1261.
2. Baylor,D.A. and Fettiplace,R.,
Synaptic drive and impulse generation in ganglion cells of turtle retina, J. Physiol, 288 (1979) 107-127.
3. Coetzee,W.A., Amarillo,Y.,
Chiu,J., Chow,A., Lau,D., McCormack,T., Moreno,H., Nadal,M.S., Ozaita,A., Pountney,D., Saganich,M., Vega-Saenz,d.M., and
Rudy,B., Molecular diversity of K+ channels, Ann. N.
Y. Acad. Sci., 868 (1999) 233-285.
4. Connors,B.W. and Gutnick,M.J.,
Intrinsic firing patterns of diverse neocortical
neurons, Trends Neurosci., 13 (1990) 99-104.
5. COOMBS,J.S., CURTIS,D.R., and ECCLES,J.C., The interpretation
of spike potentials of motoneurones, J. Physiol, 139 (1957) 198-231.
6. Dallas,M.L., Atkinson,L.,
Milligan,C.J., Morris,N.P.,
Lewis,D.I., Deuchars,S.A.,
and Deuchars,J., Localization and function of the
Kv3.1b subunit in the rat medulla oblongata: focus on
the nucleus tractus solitarii,
J. Physiol, 562 (2005) 655-672.
7. Erisir,A., Lau,D.,
Rudy,B., and Leonard,C.S.,
Function of specific K(+) channels in sustained high-frequency firing of
fast-spiking neocortical interneurons,
J. Neurophysiol., 82 (1999) 2476-2489.
8. Fohlmeister,J.F. and Miller,R.F., Impulse encoding mechanisms of ganglion cells
in the tiger salamander retina, J. Neurophysiol., 78
(1997) 1935-1947.
9. Gutman,G.A., Chandy,K.G.,
Grissmer,S., Lazdunski,M., McKinnon,D., Pardo,L.A., Robertson,G.A., Rudy,B., Sanguinetti,M.C., Stuhmer,W., and
Wang,X., International Union of Pharmacology. LIII.
Nomenclature and molecular relationships of voltage-gated potassium channels, Pharmacol. Rev., 57 (2005) 473-508.
10.
Henne,J. and Jeserich,G.,
Maturation of spiking activity in trout retinal ganglion cells coincides with upregulation of Kv3.1- and BK-related potassium channels,
J. Neurosci. Res., 75 (2004) 44-54.
11.
Henne,J., Pottering,S.,
and Jeserich,G., Voltage-gated potassium channels in
retinal ganglion cells of trout: a combined biophysical, pharmacological, and
single-cell RT-PCR approach, J. Neurosci. Res., 62
(2000) 629-637.
12.
Lee,S.C. and Ishida,A.T.,
Ih without Kir in adult rat
retinal ganglion cells, J. Neurophysiol., 97 (2007)
3790-3799.
13.
Lien,C.C. and Jonas,P.,
Kv3 potassium conductance is necessary and kinetically optimized for
high-frequency action potential generation in hippocampal
interneurons, J. Neurosci.,
23 (2003) 2058-2068.
14.
Margolis,D.J. and Detwiler,P.B.,
Different mechanisms generate maintained activity in ON and OFF retinal ganglion
cells, J. Neurosci., 27 (2007) 5994-6005.
15.
Martina,M., Schultz,J.H.,
Ehmke,H., Monyer,H., and Jonas,P., Functional and molecular differences between
voltage-gated K+ channels of fast-spiking interneurons
and pyramidal neurons of rat hippocampus, J. Neurosci., 18 (1998) 8111-8125.
16.
Massengill,J.L., Smith,M.A.,
Son,D.I., and O'Dowd,D.K.,
Differential expression of K4-AP currents and Kv3.1 potassium channel
transcripts in cortical neurons that develop distinct firing phenotypes, J. Neurosci., 17 (1997) 3136-3147.
17.
Mitra,P. and Miller,R.F.,
Normal and rebound impulse firing in retinal ganglion cells, Vis. Neurosci., 24 (2007) 79-90.
18.
O'Brien,B.J., Isayama,T.,
Richardson,R., and Berson,D.M.,
Intrinsic physiological properties of cat retinal ganglion cells, J. Physiol, 538 (2002) 787-802.
19.
Ozaita,A., Petit-Jacques,J.,
Volgyi,B., Ho,C.S., Joho,R.H., Bloomfield,S.A., and Rudy,B., A unique role for Kv3 voltage-gated potassium
channels in starburst amacrine cell signaling in
mouse retina, J. Neurosci., 24 (2004) 7335-7343.
20.
Peichl,L., Alpha and delta ganglion
cells in the rat retina, J. Comp Neurol., 286 (1989)
120-139.
21.
Perry,V.H., The ganglion cell layer of
the retina of the rat: a Golgi study, Proc. R. Soc. Lond B Biol. Sci., 204 (1979) 363-375.
22.
Pinto,L.H. and Klumpp,D.J.,
Localization of potassium channels in the retina, Prog.
Retin. Eye Res., 17 (1998) 207-230.
23.
Rothe,T., Juttner,R.,
Bahring,R., and Grantyn,R.,
Ion conductances related to development of repetitive
firing in mouse retinal ganglion neurons in situ, J. Neurobiol.,
38 (1999) 191-206.
24.
Rudy,B., Chow,A.,
Lau,D., Amarillo,Y., Ozaita,A., Saganich,M., Moreno,H., Nadal,M.S., Hernandez-Pineda,R., Hernandez-Cruz,A., Erisir,A., Leonard,C., and Vega-Saenz,d.M., Contributions of Kv3 channels to neuronal
excitability, Ann. N. Y. Acad. Sci., 868 (1999)
304-343.
25.
Rudy,B. and McBain,C.J.,
Kv3 channels: voltage-gated K+ channels designed for high-frequency repetitive
firing, Trends Neurosci., 24 (2001) 517-526.
26.
Schmid,S. and Guenther,E.,
Voltage-activated calcium currents in rat retinal ganglion cells in situ:
changes during prenatal and postnatal development, J. Neurosci.,
19 (1999) 3486-3494.
27.
Sheasby,B.W. and Fohlmeister,J.F.,
Impulse encoding across the dendritic morphologies of
retinal ganglion cells, J. Neurophysiol., 81 (1999)
1685-1698.
28.
Tabata,T. and Ishida,A.T.,
Transient and sustained depolarization of retinal ganglion cells by Ih, J. Neurophysiol., 75 (1996)
1932-1943.
29.
Tabata,T. and Kano,M.,
Heterogeneous intrinsic firing properties of vertebrate retinal ganglion cells,
J. Neurophysiol., 87 (2002) 30-41.
30.
Taschenberger,H. and Grantyn,R.,
Interaction of calcium-permeable non-N-methyl-D-aspartate
receptor channels with voltage-activated potassium and calcium currents in rat
retinal ganglion cells in vitro, Neuroscience, 84 (1998) 877-896.
31.
Taschenberger,H., Juttner,R.,
and Grantyn,R., Ca2+-permeable P2X receptor channels
in cultured rat retinal ganglion cells, J. Neurosci.,
19 (1999) 3353-3366.
32.
Tian,N., Hwang,T.N.,
and Copenhagen,D.R., Analysis of excitatory and
inhibitory spontaneous synaptic activity in mouse retinal ganglion cells, J. Neurophysiol., 80 (1998) 1327-1340.
33.
Wang,G.Y., Ratto,G.,
Bisti,S., and Chalupa,L.M.,
Functional development of intrinsic properties in ganglion cells of the
mammalian retina, J. Neurophysiol., 78 (1997)
2895-2903.
34.
Wang,G.Y., Robinson,D.W.,
and Chalupa,L.M., Calcium-activated potassium conductances in retinal ganglion cells of the ferret, J. Neurophysiol., 79 (1998) 151-158.
35. Wollner,D.A. and Catterall,W.A., Localization of sodium channels in axon hillocks and initial segments of retinal ganglion cells, Proc. Natl. Acad. Sci. U. S. A, 83 (1986) 8424-8428.