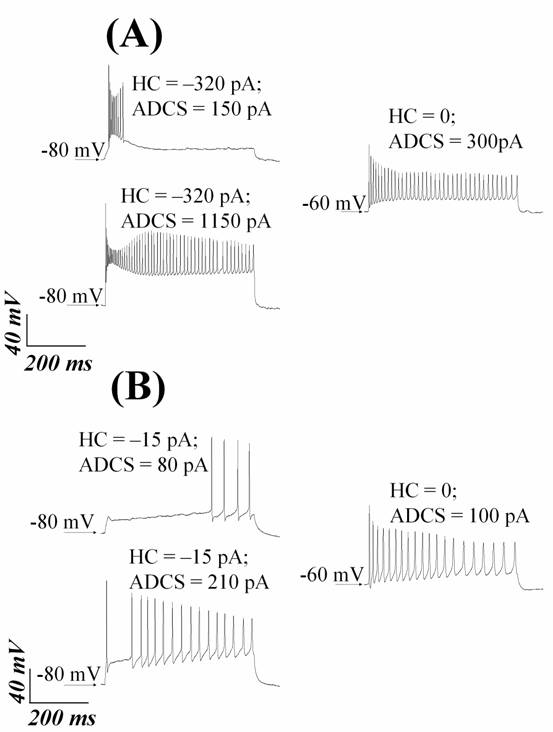
Prehyperpolarization
caused different phenomena in some subsets of retinal ganglion cells. (A)
“Rebound excitation”. Left upper trace shows the voltage response to the
simple reducing of hyperpolarization. Left lower
trace shows the voltage response to the strongest stimulating current in
tonic range. The current steps were applied from holding current of –320 pA. Right trace also shows the voltage response to the
strongest stimulating current in tonic range of this cell, however, the
holding current was zero in this recording. The respective maximal
steady-state firing frequency did not change profoundly by prehyperpolarization. (B) “Ramping”. Left upper trace
shows the voltage response to the moderate stimulation of prehyperpolarized cell. Left lower trace shows the
voltage response to the strongest stimulating current in tonic range. The
current steps were applied from holding current of –15 pA.
Right trace also shows the voltage response to the strongest stimulating
current in “tonic” range, however, the holding current was zero in this
recording. The respective maximal steady-state firing frequency did not
change profoundly by prehyperpolarization.
The holding current (HC) and amplitude of depolarizing current step
(ADCS) are indicated above each trace. The
approximated value of the potential before the stimulus is indicated near
each trace by arrow.